Insert element in Visualization
For our TRAFFICSIGNAL visualization you should proceed as follows:
Give the command ‘Insert’ ‘Ellipse’.Insert..Ellipse.>Proc and try to draw a medium sized circle (?2cm). For this click in the editor field and draw with pressed left mouse button the circle in its length.
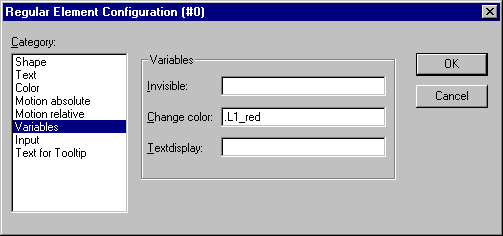
Now doubleclick the circle. The dialog box for editing visualization elements opens
Choose the category Variables and in the field Change color enter the variable name .L1_red or “L1_red”. That means that the global variable L1_red will cause the color change as soon as it is set to TRUE. The dot before the variable name indicates that it is a global variable, but it is not mandatory.
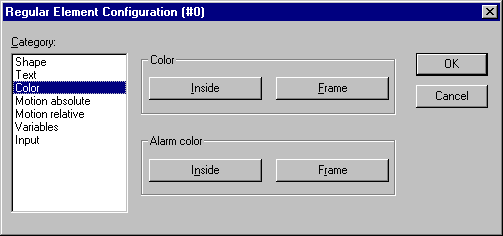
Then choose the category Color and click on the button Inside in the area Color. Choose as neutral a color as possible, such as black.
Now click on the button within in the area Alarm color and choose the red which comes closest to that of a red light.
The resulting circle will normally be black, and when the variable RED from TRAFFICSIGNAL1 is TRUE, then its color will change to red. We have therefore created the first light of the first trafficsignal!